
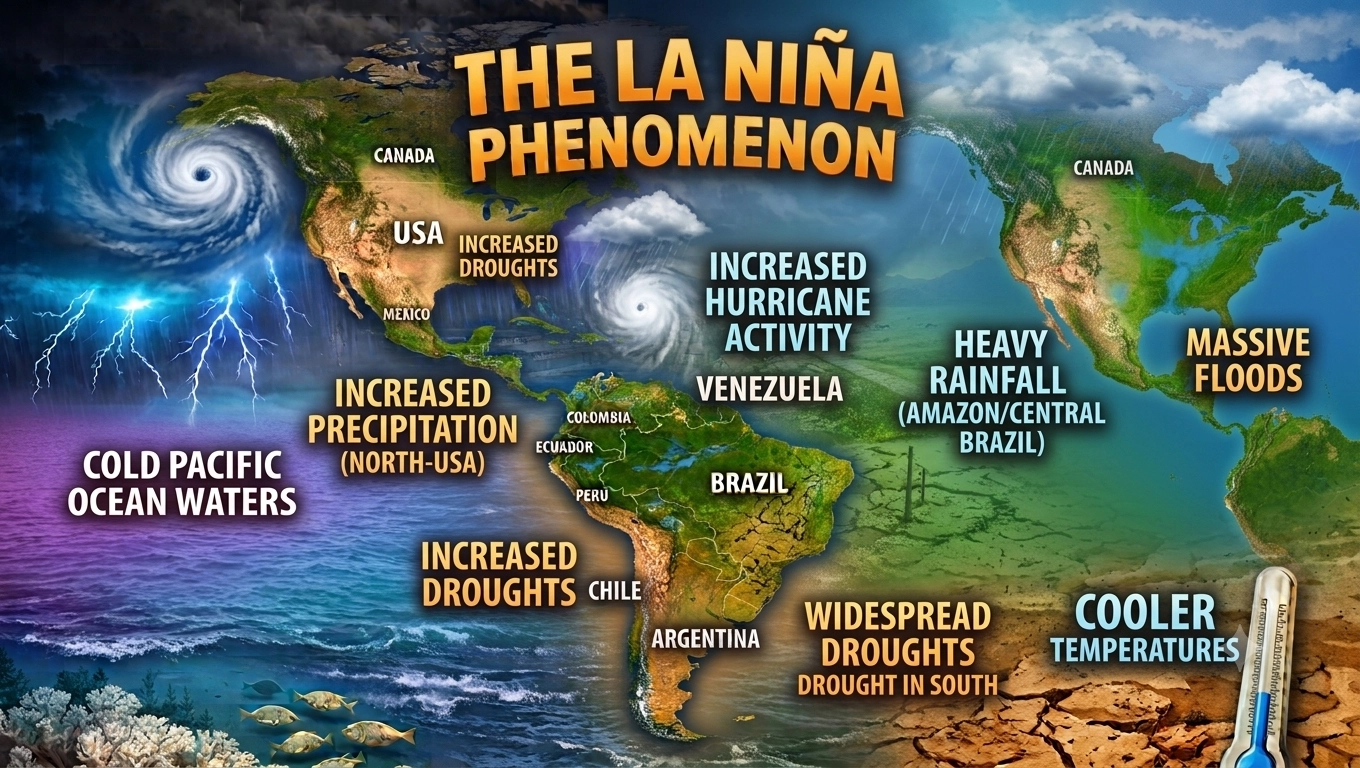
The La Niña phenomenon and Earth’s climate system
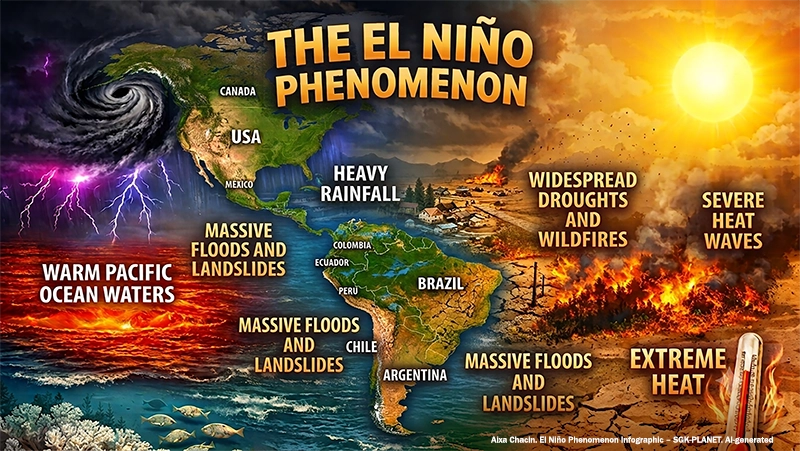
The scientific community is currently monitoring the “Super El Niño” of 2026 and record-breaking ocean temperatures with concern. At SGK-PLANET, we also analyze the other indispensable half of the story: the La Niña phenomenon.
Below, we explore the scientific origins of this anomaly and its global impacts on rainfall patterns—with a particular focus on hurricanes—and examine the urgent adaptation strategies societies must adopt in the face of climate change that is rapidly transforming the globe.
What is the La Niña phenomenon, and how does it relate to El Niño?
The World Meteorological Organization (WMO) defines the La Niña phenomenon—which is associated with El Niño—as follows:
“El Niño and La Niña are opposite phases of a naturally occurring climate pattern known as the El Niño-Southern Oscillation (ENSO). This phenomenon alters temperatures in the central and eastern equatorial Pacific and, at the same time, drives changes in the atmosphere above those waters.” —WMO
La Niña is considered the cool phase of the ENSO (El Niño-Southern Oscillation) cycle and acts as a major thermal regulator for the planet. However, its onset also triggers severe atmospheric dynamics across multiple continents.
The El Niño-Southern Oscillation (ENSO) phenomenon is a naturally occurring pattern of climate variability (alternating between El Niño and La Niña episodes). La Niña is not caused by climate change—it is a natural cycle—but global warming does affect the phenomenon by altering the intensity and frequency of associated extreme events.
It occurs every two to seven years and exerts a major influence on weather patterns across many parts of the world, triggering extreme climate events such as droughts, floods, and storms. La Niña is expected—though not guaranteed—to follow an El Niño episode, particularly if the El Niño event was intense.
Origins of the La Niña phenomenon
La Niña has a long history of influencing the climate. According to the INPE, it was first recorded in 1892–1893. However, in 2022—after occurring in the Pacific Ocean for a third consecutive year, as reported by the World Meteorological Organization—the phenomenon gave way to El Niño, and global temperatures reached record highs.
The atmospheric phenomena affecting global temperatures—El Niño and La Niña—originate in the equatorial Pacific Ocean (and the surrounding atmosphere) and have been monitored by research organizations for over a century.
Measurement systems for ENSO
In 1923, physicist Sir Gilbert Walker discovered the Southern Oscillation phenomenon while observing large-scale changes in sea-level atmospheric pressure across the tropical Pacific. In the late 1960s, meteorologist Jacob Bjerknes concluded that changes in the ocean and atmosphere were linked, giving rise to the term “ENSO.”
The National Oceanic and Atmospheric Administration (NOAA) uses the Oceanic Niño Index (ONI) to determine the occurrence and intensity of El Niño. They calculate the tropical sea surface temperature (SST) anomaly value for a specific Pacific region known as the Niño 3.4 region. The three-month average of this anomaly constitutes the ONI.
In February 2026, NOAA’s Climate Prediction Center adopted the Relative Oceanic Niño Index (RONI) to better identify past events and predict future ENSO activity. It monitors sea surface temperatures and changes in the Walker circulation, providing more useful information for forecasting El Niño and La Niña.
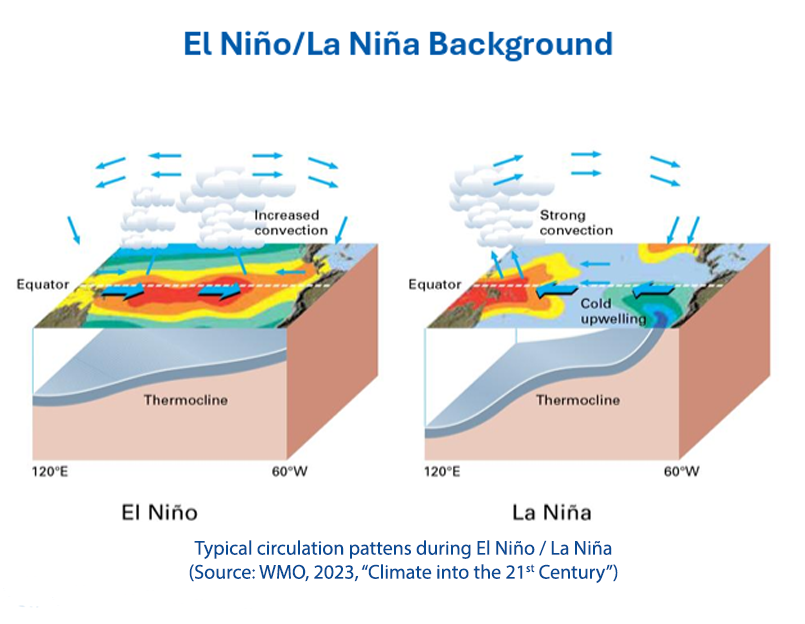
The ENSO cycle at a glance: Differences between El Niño and La Niña
Global impacts of the La Niña phenomenon
One characteristic of La Niña is that the easterly trade winds near the equator intensify beyond their usual strength. These stronger winds push surface water toward the western Pacific, while simultaneously causing colder water from greater depths to rise in the eastern Pacific.
If this cooling persists, it can inhibit air uplift and precipitation in the eastern Pacific, thereby triggering a La Niña event. As the phenomenon evolves, the cooling of the waters causes the winds to intensify further, which can lead to a further drop in water temperatures.
According to an FAO report, the most recent La Niña event occurred between September 2025 and early 2026, increasing the frequency of weather events capable of damaging crops and consequently exacerbating local food insecurity.
To better understand how this climate driver works, we have prepared a comparison chart outlining the key characteristics of both phases of the Southern Oscillation.
| Characteristics | El Niño (Warm phase) | La Niña (Cold Phase) |
|---|---|---|
| Sea temperature | Anomalous warming in the equatorial Pacific | Anomalous cooling in the equatorial Pacific |
| Trade Winds | Weaken or change direction (West to East) | Strengthen extraordinarily (East to West) |
| Climate in South America | Torrential rains on the coasts of Peru and Ecuador | Droughts and low temperatures on the Pacific coast |
| Climate in Colombia/Caribbean | Extreme droughts, heat, and low river levels | Heavy rains, floods, and storms |
| Climate in Asia/Australia | Prolonged droughts and high risk of wildfires | Torrential monsoons and widespread flooding |
| Atlantic Hurricanes | Lower activity (high wind shear) | Highly active and destructive seasons (low wind shear) |
| Impact on Fishing | Negative (fish migrate due to a lack of nutrients) | Excellent (cold, nutrient-rich water rises) |
Mitigation and adaptation plans for La Niña
Since La Niña is not a human-induced event, we cannot speak of mitigating the phenomenon itself—that is, we cannot prevent it from occurring. Therefore, mitigation efforts must focus on reducing impacts and material damage. We must then turn to adaptation, seeking to adjust long-term activities to coexist with these environmental changes.
The 2025–2026 La Niña event heightened the risk of droughts, floods, and agricultural disruptions across several regions. Lower rainfall is forecast for East Africa, Central Asia, and the Near East, likely reducing crop yields and increasing food insecurity. In Southern Africa and South America, excessive rainfall could lead to losses and displacement.
Mitigation: Acting before the event occurs.
In response to the onset of a strong La Niña event in 2025, the FAO (Food and Agriculture Organization of the United Nations) launched its La Niña Anticipatory Action and Response Plan, aiming to “protect the food security and livelihoods of rural communities” against the potential impact of the phenomenon.
Two-stage plan:
- Anticipatory actions: protecting fishermen’s boats before storms, reinforcing river embankments against potential flooding, distributing drought-resistant seeds to farmers, and safeguarding livestock health.
- Early responses: provision of critical supplies—such as medicines for both the human population and livestock to combat potential epidemics, and flexible water storage tanks—and the delivery of financial aid to affected families to cover basic needs.
Adaptation
To achieve long-term, comprehensive adaptation to the effects of the La Niña phenomenon, countries—through their designated agencies—and local and international industries must take action before the phenomenon arrives, given that the human and financial impact is steadily increasing and reaching incalculable proportions.
When the La Niña phenomenon occurs, it is necessary to adopt plans involving key actions implemented by emergency management agencies and disaster planners at all levels. Let us look at the actions that should be taken.
- Update risk assessments: Review historical data on how La Niña has affected your region. Use this information to update hazard maps and refine response plans.
- Strengthen communication networks: Effective communication is crucial for community preparedness. Ensure that accessible warning systems, public information campaigns, and evacuation protocols are in place.
- Improve infrastructure resilience: Coordinate efforts between engineers and planners to assess infrastructure vulnerabilities. Prioritize flood control measures, wildfire mitigation, and storm-resistant designs.
- Assess the vulnerability of transportation networks: Engineers and urban planners must evaluate roads, bridges, and drainage systems in areas at high risk from extreme weather conditions. Consider designs that enhance infrastructure durability in the face of changing weather patterns.
- Coordinate resource allocation: Stockpile emergency supplies and pre-allocate resources to areas most likely to be affected by La Niña-related hazards.
- Engage stakeholders: Collaborate with local governments, non-profit organizations, and private-sector partners to develop comprehensive preparedness and recovery strategies.
Sandor Alejandro Gerendas-Kiss
SGK-PLANET Editor
Sources consulted
Berkson, Dan. (2026, June 2). Ocean Conservancy. Do You Know the Difference Between El Niño and La Niña? https://oceanconservancy.org/blog/2026/06/02/difference-el-nino-la-nina/
Di Liberto, Tom. (2024, February,8). NOAA. Climate.gov. February 2024 ENSO Outlook: All along the La Niña Wacht-tower. https://research.noaa.gov/50-years-of-getting-enso-predictions-mostly-correct/
FAO. Food and Agriculture Organization. (2025, January). La Niña Anticipatory Action and Response Plan. Mitigating the expected impacts of La Niña‑induced climate extremes on agriculture and food security. https://openknowledge.fao.org/items/08f3ee22-e938-4124-b52b-cb9926a95efd
WOM. World Meteorological Organization. (s/f). El Niño/La Niña. https://wmo.int/themes/el-nino-la-nina-phenomena
NOAA. Climate.gov. By Climate.gov Staff. (2016, January 18). What causes El Niño and La Niña to occur? https://www.climate.gov/news-features/understanding-climate/el-nino-and-la-nina-frequently-asked-questions
NOAA. Research. (2024, February 27). 50 years of getting ENSO predictions “mostly” correct. https://research.noaa.gov/50-years-of-getting-enso-predictions-mostly-correct/
NOAA. National Oceanic and Atmospheric Administration (2026, June 11) El Nino forms, expected to strengthen, say NOAA forecasters. https://www.noaa.gov/news-release/el-nino-forms-expected-to-strengthen-say-noaa-forecasters
NOAA. National Weather Service Climate Prediction Center. Relative Oceanic Niño Index (RONI):Historical El Niño / La Niña episodes (1950–Present). https://www.cpc.ncep.noaa.gov/products/analysis_monitoring/enso/roni/
Tidal Basin Group. (2024, 21 de noviembre). Preparación para La Niña. https://www.tidalbasingroup.com/preparing-for-la-nina/

Leave A Comment